i-Box Kolsass
Valley-floor site (CS-VF0)
Description
The Innsbruck Box (i-Box) is a testbed for studying boundary layer processes in highly complex terrain. Designed to be a long-term "reference box" for studying the characteristics of turbulence structure and exchange processes in truly complex topography, i-Box represents an integrated approach combining three-dimensional long-term turbulence observations with high-resolution numerical modeling. The i-Box observational stations are located in the Inn Valley, an approximately northeast-southwest oriented valley in western Austria, characterized by very complex terrain with steep slopes, flat foothills, numerous side valleys, and variable land use characteristics. The locations of the core sites (six turbulence stations) were chosen to represent different topographic features in order to secure the universality of the obtained results. Further information about the i-Box project can be found in Rotach et al. (2017) and on the i-Box WIKI.
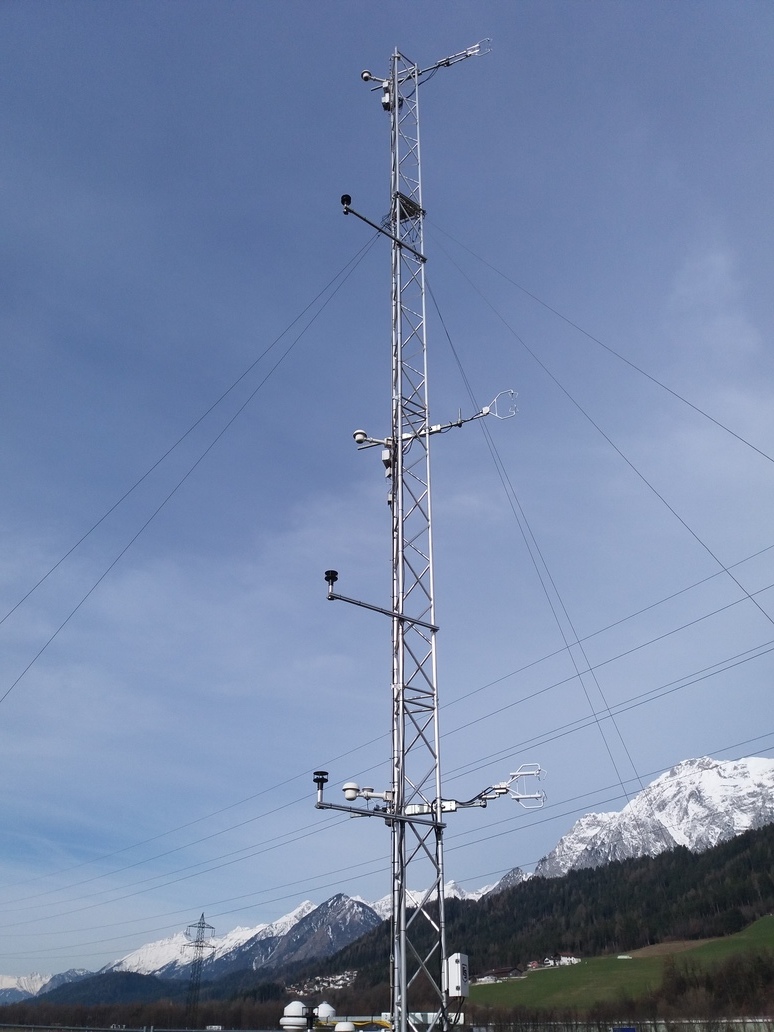
The i-Box valley-floor site is located on the almost flat floor near the town of Kolsass. The site is characterized by different types of agricultural land. The 17-m high tower is a full energy-balance station and is instrumented with three vertical levels of turbulence measurements.
Site characteristics
Coordinates: 47.305341°N, 11.62219°E (UTM: 698215.03 E, 5242420.95 N)
Altitude: 545 m MSL
Slope angle: < 0.5˚
Slope orientation: 188˚
Surface characteristics: mixed agricultural
Status: operational since July 2013
Power supply: AC
Datalogger: CR3000
History/logbook: logbook and data availability
Instrumentation
| Instrument | Height | Serial number | Notes |
|---|---|---|---|
| Turbulence | |||
| CSAT3 | 4.0 m | Angle to true north: 30˚ | |
| EC150 | 4.0 m | Path length: 0.045 m | |
| CSAT3 | 8.68 m | 2282 | Angle to true north: 30˚ |
| CSAT3 | 16.93 m | 2287 | Angle to true north: 30˚ |
| Campbell KH20 | 16.93 m | 1720 1698 |
until 11 Jul 2017 Path length: 0.0134 m Path separation: 0.17 m xkw: -0.195 ln(mV)m3/g Intercept: 3528 mV 11 Jul 2017 - 13 Jul 2020 Path length: 0.012 m Path separation: 0.17 m xkw: -0.18 ln(mV)m3/g Intercept: 1837 mV |
| Irgason | 16.93 m | since 14 Jul 2020 Angle to true north: 30˚ |
|
| Temperature/Humidity | |||
| Rotronic HC2-S3 | 2.0 m | since 30 Nov 2016 | |
| Rotronic HC2-S3 | 4.0 m | since 30 Nov 2016 | |
| Rotronic HC2-S3 | 8.7 m | since 30 Nov 2016 | |
| Rotronic HC2-S3 | 16.93 m | ||
| Wind | |||
| Gill WindSonic4 | 2.0 m | since 30 Nov 2016 | |
| Gill WindSonic4 | 4.0 m | since 30 Nov 2016 | |
| Gill WindSonic4 | 6.0 m | since 30 Nov 2016 | |
| Gill WindSonic4 | 12.0 m | since 30 Nov 2016 | |
| Pressure | |||
| Setra 278 | 4991767 | in logger box | |
| Precipitation/Snow | |||
| SR50A | since 17 Sep 2018 | ||
| Rain gauge | since 17 Sep 2018 | ||
| Radiation | |||
| CMP21 | |||
| CGR4 |
Datasets
- RAWDATA
- Uncorrected 1-min raw data, no quality checks applied
- RAWDATA_TRH_PROF
- Uncorrected 1-min raw data from three levels of Rotronic temperature and humidity sensors (2.0, 4.0, and 8.7 m), no quality checks applied
- RAIN
- Uncorrected 1-hour precipitation and snow depth data, no quality checks applied
- EDIRE_L3
30-min turbulence statistics (former processing with Edire) Processed turbulence data with an averaging interval of 30 min for the top turbulence measurement level at 16.9 m (processing was performed using EdiRe)
Processing includes despiking; double-rotation of the wind components; detrending with a recursive filter and a time constant of 200 s; and applying frequency-response corrections, heat-flux corrections for humidity effects, oxygen corrections for KH20, and WPL corrections. The datafile contains several quality flags.
- EDIRE_L1AND2
30-min turbulence statistics (former processing with Edire) Processed turbulence data with an averaging interval of 30 min for the two lowermost turbulence measurement levels at 4.0 and 8.7 m (processing was performed using EdiRe)
Processing includes despiking; double-rotation of the wind components; detrending with a recursive filter and a time constant of 200 s; and applying frequency-response corrections, heat-flux corrections for humidity effects, oxygen corrections for KH20, and WPL corrections. The datafile contains several quality flags.
- WINDSONIC4
- 1-min averaged wind speed and wind direction from 1-Hz 2D WindSonic data, no quality checks applied
- ZEROPLANE
Annual cycle of zero-plane displacement height (Sfyri et al. 2018)
d = (74.606725922013820*log(jd)-3.391767627768317e+02)*0.01 for jd = 1 Jun - 30 Sep and wind direction = ]338.06, 158.26]
- ECPY_30MIN
- 30-min turbulence statistics (processed with ECpy) COLUMNDESCRIPTION
- ECPY_3MIN
- 3-min turbulence statistics (processed with ECpy) COLUMNDESCRIPTION